Titanic - Machine Learning from Disaster
- Ajay Reddy
- Sep 29, 2021
- 3 min read

Updated: Sep 29, 2021

Overview
As we all know that the Titanic sank on her maiden voyage. In this blog we will analyze the data of the passengers to create a Machine Learning model using the passengers data of the Titanic to predict who will survive the crash.
Analyzing the Data
There are three files provided in the data to train the algorithm and to predict the survivors:
(1) train.csv : This file contains the details of 891 passengers which includes their passenger id, name, age etc.
(2) test.csv : With the help of the patterns that are found in the training data set we need to predict how many of the remaining 418 passengers survived.
(3) gender_submission.csv : This is an example file which shows how to form the patterns to predict. This file follows the hypotheses that all the female passengers survived and all the male passengers died.
To import the data we need to know the location of the files. The below lines of code gives us the location of the files as the output. Here we need to install "numpy" and the "pandas" library to read the files and perform specific operations.

The above code gives the location of the files as the output.

Read the Data from the CSV Files
Once we know the location of the files we need to read the data from the file. With the help of pandas library we can read the CSV file. This can be achieved by specifying the location of the file.


Here the train_data.head() and the test_data.head() functions gives the first five rows of the each table as the sample. Through which we can get to have a brief idea about the contents of the file.
Finding a Pattern
According to the "gender_submission.csv" hypotheses, all the female passengers survived and all the male passengers did not. Let us find the percentage of women and men who survived.
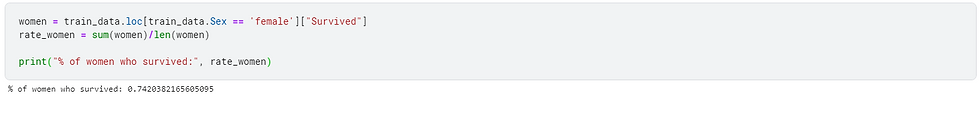

The above code calculates the percentage of women and men that survived the crash. Hence 74% of the women survived the mishap whereas only 19% of the men survived as per the data.
Building the Model
In Python we can build the machine learning models using "scikit-learn" library. Various machine learning models are provided in this library but let us begin with the "Random Forest Classifier" model for our problem to predict the solution. It is a Supervised-learning algorithm that can be used for classification(In this case whether the passenger survived or didn't) problems.
In this case we are considering whether the passenger survived based on the following four features - Pclass, Sex, SibSp, Parch and building the patterns using Random Forest Classifier. It constructs the trees in the random forest model based on patterns in the train.csv file, before generating predictions for the passengers in test.csv and save the output to a new csv file "submission.csv".

Using the Random Forest Classifier the score of the model is "0.77511".

Contribution:
In the above code as per the tutorial I have used "Random Forest Classifier Model". By using this model the score has been limited to 0.77511 without any data preprocessing techniques. But as there are many other classifiers such as decision tree regressor, Gaussian Naive Bayes classifier, Linear Support Vector Machine etc.
Support Vector Machine or SVM is one of the most popular Supervised Learning algorithms, which is used for Classification as well as Regression problems. However, primarily, it is used for Classification problems in Machine Learning. Hence, I have used other classifiers to improve the score. One such model is using "Support Vector Machine" model . By using this model the score has been increased to "0.77751".


References:
The Random Forest Classifier part of the model was inspired from https://www.kaggle.com/alexisbcook/titanic-tutorial
The Support Vector Machine model was inspired from


Comments